 ICE detention fell to 68,289 after hitting a record high of 70,766. The drop is too early to call a trend. Ankle monitors climbed past 42,000.The latest ICE detention data shows that on February 7, 2026, 68,289 people were held in immigrant detention facilities across the country. This is a decline of 2,477 from the previous data release, which showed a record-high detained population of 70,766 on January 24. This number does not include people detained in short-term facilities along the border, ICE field offices, courtrooms, or other locations where ICE has reportedly held people for immigration purposes.
What’s behind the decline? The honest answer is that I don’t know for certain. There are a few plausible contributing factors. As ProPublica recently reported, there has been a surge in habeas corpus petitions filed on behalf of people in ICE custody. Many federal judges—including Trump-appointed judges—have also recently ruled against the agency’s detention practices. It is possible that the law is beginning to catch up with the agency.
But I think the more likely explanation is a combination of these legal developments and the kind of routine fluctuations that show up in ICE detention data over time. As the arrest data below shows, ICE averaged 1,280 arrests per day in January, the highest daily rate in the data, but the first week of February already showed a decline to 1,020 arrests per day, lower than any monthly rate going back to August. A dip in enforcement activity, combined with increased litigation and adverse court rulings, could account for a decline of this size.
I hesitate to attach too much meaning to this drop unless the trend continues. This is not the first time during the Trump administration that detention numbers have declined over a two-week period only to shoot back up in the next data release.
ICE Total Detained Population (2/7/2026)
Create interactive, responsive & beautiful charts — no code required.
The biggest drop in the detained population came from people ICE classifies as “Other Immigration Violators,” meaning people with no criminal charges or convictions on their record. Among people arrested by ICE, this group declined from 26,044 on January 25 to 24,495 on February 7, a decrease of 1,549 people. Of the total decline of 2,143 among ICE-arrested detainees, that represents 72 percent.
This is not surprising. People without criminal records are the group most likely to be eligible for release because mandatory detention laws and policies are less likely to apply to them.

To learn more about the frontlines of reporting on ICE detention, join The Washington Post’s Doug MacMillan and myself on February 17, next Tuesday, for a live virtual discussion. Learn more and register here.
Detained Population by Criminal History (ICE Arrests Only, 2/7/2026)
Create interactive, responsive & beautiful charts — no code required.
In the past, I have represented ICE arrest data as total arrests per month, and when only partial data was available for a month, I projected the estimated total arrests by month’s end. I’ve moved away from this approach because these projections were rarely very accurate. There is simply too much fluctuation from week to week for end-of-month estimates based on partial data to be reliable.
Instead, I am now showing average arrests per day. This gives a more precise comparison regardless of whether we have seven days of data in a month or thirty-one, because we are comparing a more consistent unit of measurement.
By this measure, January averaged 1,280 ICE arrests per day, the highest daily rate in the data. But the first week of February showed a notable decline to 1,020 arrests per day, lower than any monthly average going back to August.
ICE Average Daily Arrests (Oct ’24 – Feb ’26)
Create interactive, responsive & beautiful charts — no code required.
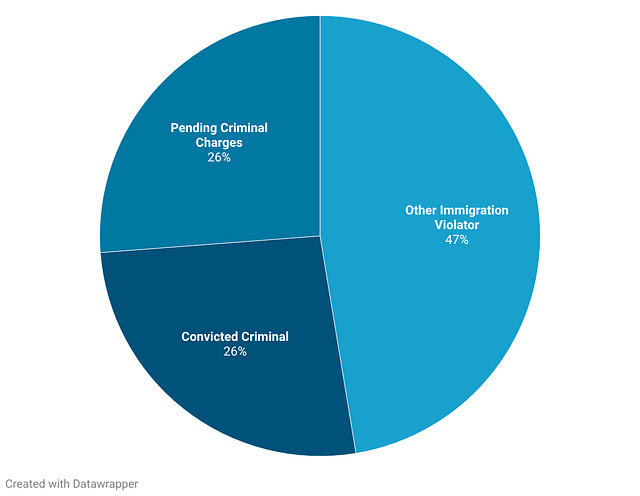
When we combine all people arrested by ICE and CBP together, 47 percent of all people held in detention had no criminal convictions or charges on their record. They fell under the category of “Other Immigration Violator,” meaning they only have immigration violations or suspected violations on their record. This percentage has remained largely static for many months.
Current Detained Population (ICE & CBP, 2/7/2026)
Create interactive, responsive & beautiful charts — no code required.
The overall number of people on alternatives to detention (ATD) increased slightly to a current total of 179,991 people on electronic monitoring. The trend in ICE’s Alternatives to Detention enrollment continues, with ICE shuffling people off the smartphone tracking app known as SmartLINK and ramping up the number of people on the more punitive GPS ankle monitors. There are now 42,115 people on GPS ankle monitors, continuing the upward trajectory that has marked this technology’s expansion under the current administration.
To learn more about ATD and the rarely discussed non-detained docket, join Claire Trickler-McNulty and myself on February 24 for a live virtual discussion that will open up a whole new can of worms that no one is talking about. Learn more and register here.
ATD Population by Technology (2/7/2026)
Create interactive, responsive & beautiful charts — no code required.
ICE ATD Population on GPS Ankle Monitors (2/7/2026)
Create interactive, responsive & beautiful charts — no code required.
Please Use and Share These Visualizations
Please feel free to use these visualizations any way that you see fit with attribution, no need to ask permission. Note that you can download the data for each visualization, download a static image, or embed the visualization in your own website. Spread the data.
Support Public Scholarship
This week I shared some reflections on the impact this newsletter is having on the national immigration conversation and why reader support matters more than ever. You can read that post here. If you have the means and believe in this work, consider becoming a paid subscriber.